Help Menu
You are here: Help » Example Workflows Tools » Workflow 3: View the effects of a list of 30 genes on Cell Viability from all genome-wide screen data within the database.
Workflow 3
View the effects of a list of 30 genes on Cell Viability from all genome-wide screen data within the database
This is an example workflow for a user with a list of 30 interesting genes who wants to analyse whether any of the 30 genes show patterns of cell viability effects across different cell lines and conditions.
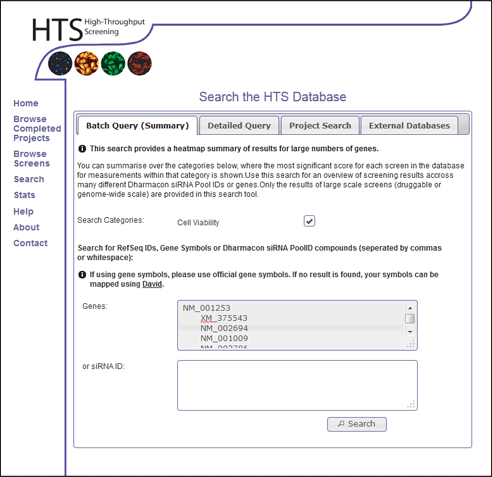
- Click the "Search" link in the main menu.
- Enter the following RefSeq IDs of the genes into the Genes: input box.
NM_001253 XM_375543 NM_002694 NM_001009 NM_002786 NM_016175 XM_292836 XM_290506 NM_003457 NM_153750 NM_182517 NM_018225 NM_014402 NM_004523 XM_375261 NM_014338 NM_004856 XM_029805 XM_371023 NM_005471 NM_017431 XM_371781 NM_012346 NM_002265 NM_002295 NM_020701 NM_173586 XM_370727 NM_001716 NM_017861 - Select the Cell Viability option within the search categories.
- Click Search
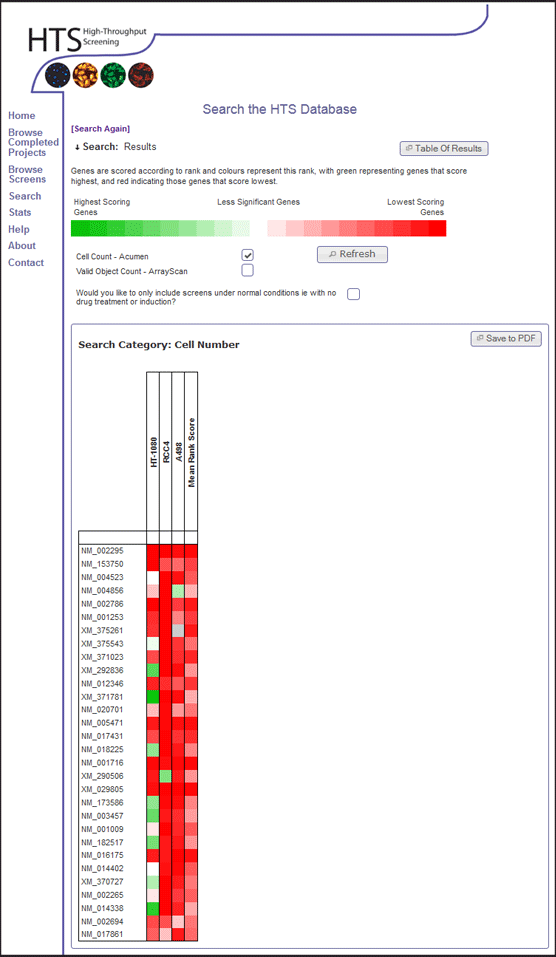
- The results show a heat map. Sort the heat map by Mean Rank Score by clicking the white square beneath the "Mean Rank Score" label.
- This orders genes by their average rank in terms of cell viability across all genome-wide data within the database.
- Download the PDF of the heat map for future reference, by clicking the "Save to PDF" button. When the PDF appears in the browser, click the save button and save for your records.

Figure 1

Figure 2