Help Menu
You are here: Help » Example Workflows Tools » Workflow 2: Identify a possible hit list from the Identification of novel molecules involved in autophagy project.
Workflow 2
Identify a possible hit list from the Identification of novel molecules involved in autophagy project
This is an example workflow for a user with a specific interest in the biology associated with one project. The hit list produced could be used to identify possible genes involved in a pathway of interest, or analysed to support a hypothesis generated from an external project.
- Find the project by browsing projects. Click to open the Project View.
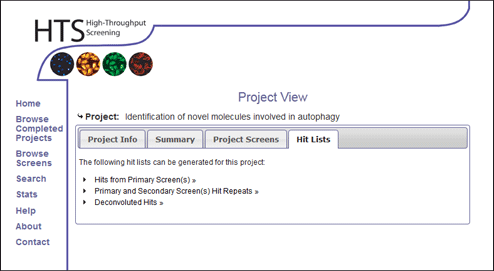
- Click the Hit Lists Tab and click the Hits from Primary Screen(s) >> link.
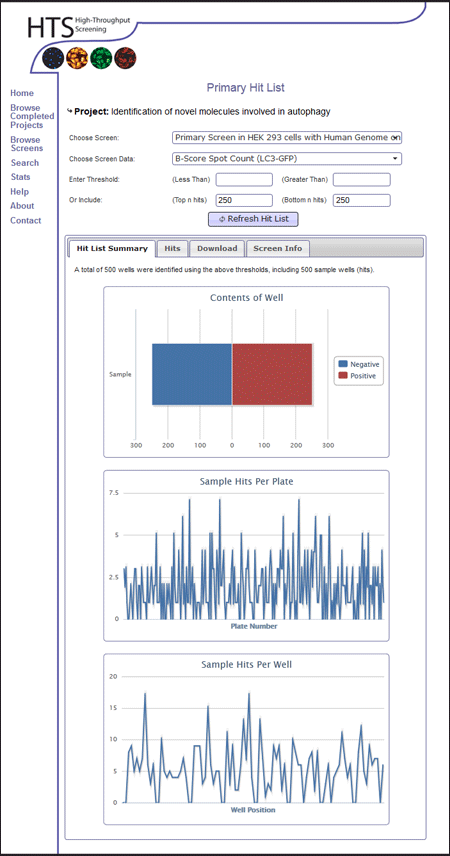
- Select the appropriate data measurement to base hits upon. In this example we are interested in the LC3-GFP measurement, and will produce two hit lists, one using the B-score Spot Count and one using B-score Total Intensity to compare how hits from the different data measurements compare
- Select a suitable threshold for the hitlist. In this example, we are interested in the top 250 positive hits from the primary screen. Enter 250 into the (Top n hits) box. Select the first data set.
- Click the Refresh Hit List button.
- View the associated graphs to see that roughly equal numbers of hits come from all plates, and well positions. In this case many hits come from plate 26. This might require attention, and is worth remembering when analysing the hit list.
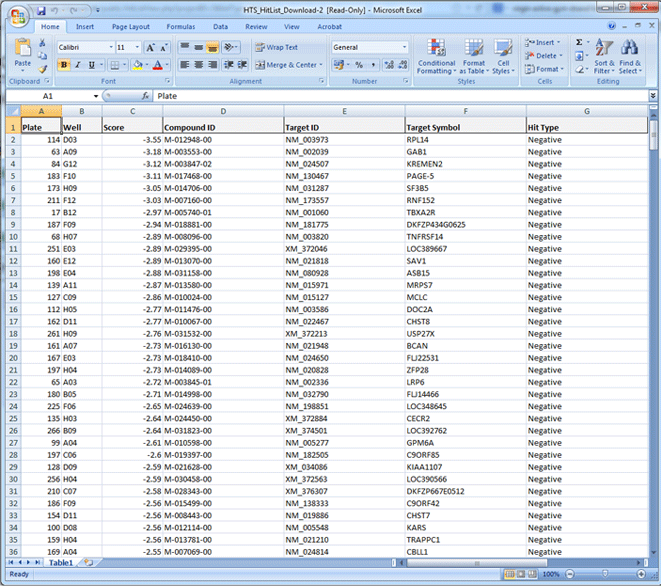
- Click the "Download" tab, and download the hits as an excel spreadsheet.
- Repeat steps 4-7 for the second data set.

Figure 1

Figure 2

Figure 3