You are here: Help » Database Basics »Data View » Deconvoluted Data View
Data View
There are two types of data view within the database.
- Analysed Data Set View
- Deconvoluted Data View
Deconvoluted Data View
Deconvoluted data refer to screens where individual oligos are screened instead of pools. We have a deconvoluted library available that we cherry pick for secondary validation work. Each of our pools contains four different oligos, so the deconvolution library holds four oligos for each pool. Dharmacon IDs follow the following format:
- Pools: M-xxxxxx-xx or MU-xxxxxx-xx, where the central 6 digits act as a "core ID" and the remaining two digits at the end refer to a version number.
- Single Oligos: D-xxxxxx-xx or L-xxxxxx-xx, where the central 6 digits act as a "core ID" and the remaining two digits at the end refer to a version number.
The core IDs between related pools and single oligos are the same. So for example a pool targeting the gene NM_004207 (SLC16A3) has an ID of M-005126-01 and contains oligos D-005126-03, D-005126-04, D-005126-05, D-005126-06.
Deconvoluted data is a summary of the four oligos which make up the pool, and are scored as such, so that if one oligo repeats as a hit, the pool is defined as a 1/4 hit (1 out of 4). If two oligos repeat as a hit it is scored as 2/4 and so on.
An oligo is defined as a hit if the percent of control is above or below a certain threshold, and if it is the same direction as the primary screen. So for example, if a pool scored with a negative Z-score of -3.5, each oligo would be scored against the negative threshold (for example 0.6 of the control).
We also use a method known as Redudant siRNA activity (RSA) to calculate a p-value to define whether the ranking of the group of four oligos is significant or could happen by chance, within the deconvolution screen. Please see the following reference for an explanation of this method: Konig et al., 2007.
The user must be viewing a secondary deconvolution screen in order to see a link to the deconvoluted data view.

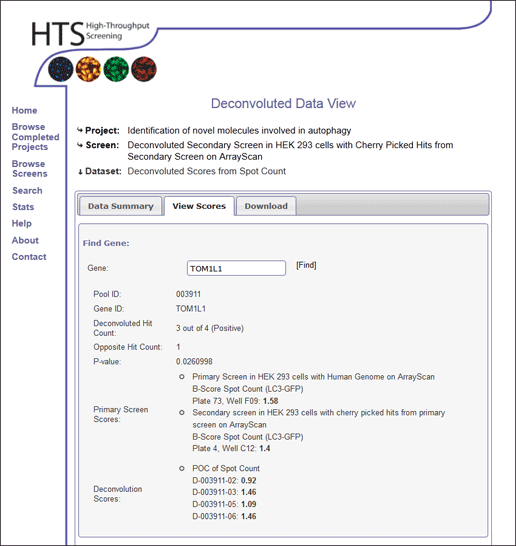
View Scores
Scores for pools within the deconvoluted data set can be viewed by searching for a gene ID. Alternatively genes can be identified by displaying deconvolution results by score or p-value cut off.
Download
Individual deconvolution datasets can be downloaded where the choice of data can be selected in the Download tab. The user can chose to download the complete dataset, or limit themselves to a specific score range or p-value cutoff.
Data is downloaded as an Microsoft Excel file (.xls). If this is not required, please feel free to contact the HTS lab for plain text versions.