You are here: Help » Database Basics » Project Compound View
Project Compound View
A compound used for screening (eg siRNA, dsRNA, chemical etc) can be viewed within the scope of the project. This page is linked to by the search functions.

Compound Data
Within the Compound Data tab, each screen within the project that contains the chosen compound is displayed. The data for each measurement can be displayed, and is updated when the user selects different data measurements.
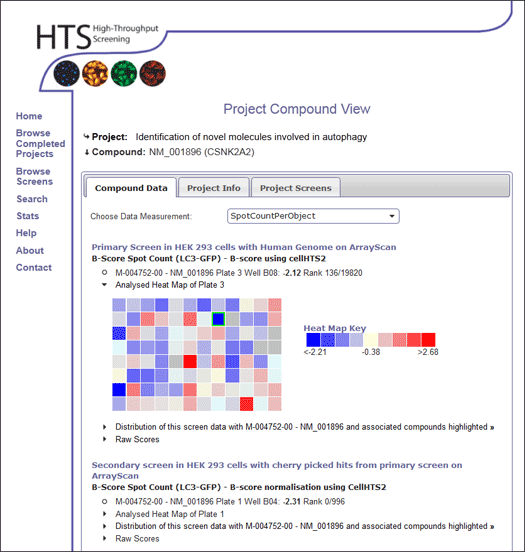
When a triangular arrow appears as the character for the bullet point list, it indicates that the user can expand or link to further information. When an open circle character is used, this indicates no more information is present (Figure 1, Arrow A).
A analysed heat map of the plate containing the compound of interest can be displayed within the screen shown. The position of the selected compound is highlighted with a cyan border (Figure 1, Arrow B). For more information on heat map views please click [here].
In order to see where the compound of interest fits into the rest of the screen data, a link is provided to show where the compound falls within the distribution of all screen data scores for the selected measurement (Figure 1, Arrow C). This links to the Graph View page.
Raw scores can be expanded, where the value for each raw replicate is shown (Figure 1, Arrow D). The raw data heat map can also be shown, where the position of the selected compound is again shown with a cyan border. For more information on heat map views please click [here]. A standard deviation heat map of the replicates can also be shown for the selected compound.
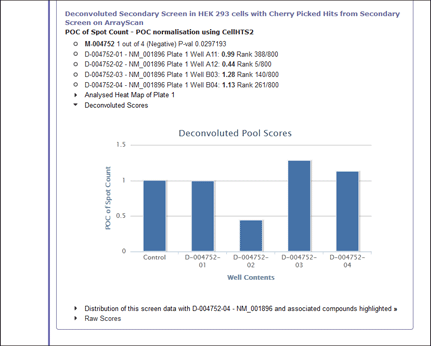
If the compound is present in a secondary deconvolution screen, deconvoluted pool scores are displayed for the compound compared to their control (Figure 2).

Project Info
Information on the selected project is shown.
Project screens
This tab provides a list of the screens associated with the project, providing links to the Screen View page.