You are here: Help » Interactive Tools » Hit Lists » Repeat Hit Lists
Repeated Hits
If the project contains secondary screens based on hits identified within the primary screens, there will be an option to identify which hits repeated with the same phenotype as seen in the primary screen.
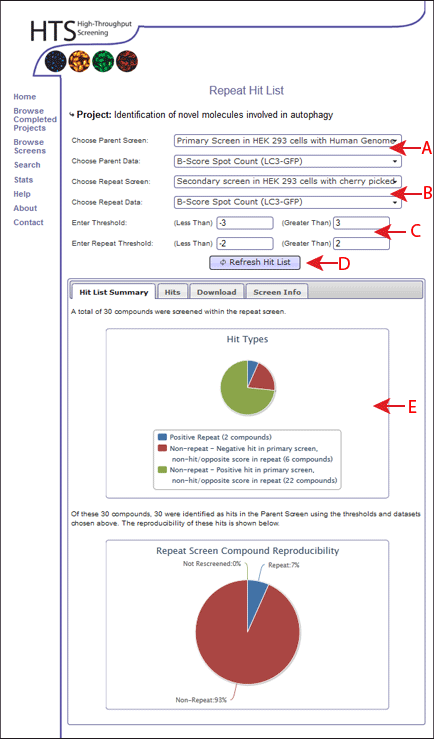
In order to define a hit list, the user can select the "parent" primary/pilot screen they intend to use, as well as the data measurement they wish to apply the threshold to (Figure 1, Arrow A). The user must also select the "repeat" secondary screen which they intend to use, and the associated data set (Figure 1, Arrow B). A choice of negative (less than) and positive (Greater than) thresholds are available to apply to the primary screen and the repeat screen. For example, the user may wish to produce a list of genes that scored with a z-score of < -3 in the primary screen and < 0.7 percent of control in the secondary repeat (Figure 1, Arrow C).
Each time an input is changed, the user must click the "Refresh Hit List" button to update the results (Figure 1, Arrow D).

Hit List Summary
Using this hit list generation, it is possible to see a summary of the hit list produced using the Hit List Summary tab. A summary of how many hits repeated in the same direction or different directions to the primary screen is shown (Figure 1, Arrow E).
Hits Tab
Tables displaying the selected hits are shown in the "Hits" tab. These tables are sortable, each column header can be selected and the hits sorted appropriately. This data can be downloaded as an Microsoft Excel file using the "Download" tab.
Download
All hit lists that are generated using these tools can be downloaded using the "Download" tab.
Data is downloaded as an Microsoft Excel file (.xls). If this is not required, please feel free to contact the HTS lab for plain text versions.